|
Solution
This time, there was no perfect solutions. Therefore, it was not easy to determine the best ones. Below, the solutions are provided together with motivations why bonus points were (or were not) given.
Let us start with the solution of Alexandra Vasileva. Part A:
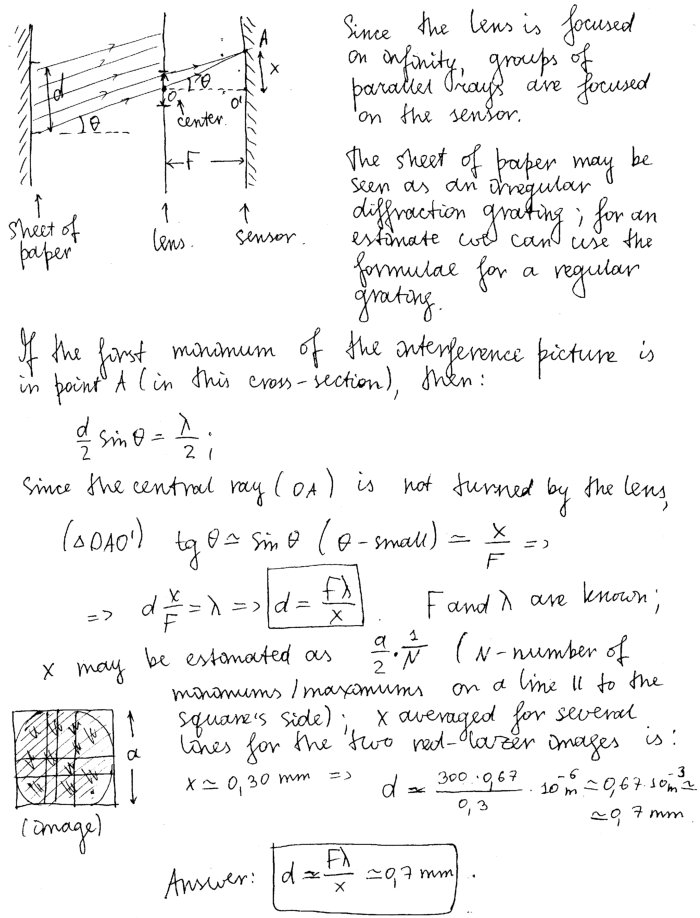
Here, the geometrical optics part is clear and simple; it would have been nice to it were also stated that the lens does not contribute to the optical path difference for parallel rays (as it follows from the Fermat's principle: all these rays connect an infinity point with its image at the sensor and hence, have equal optical path lengths). The part were the diffraction pattern (minimum-to-maximum distance) is calculated, is very brief – just stating that as an approximation, we can use the ordinary diffraction grating formula. While it lacks details, this is not wrong, and the other solutions were not better.
Part B:
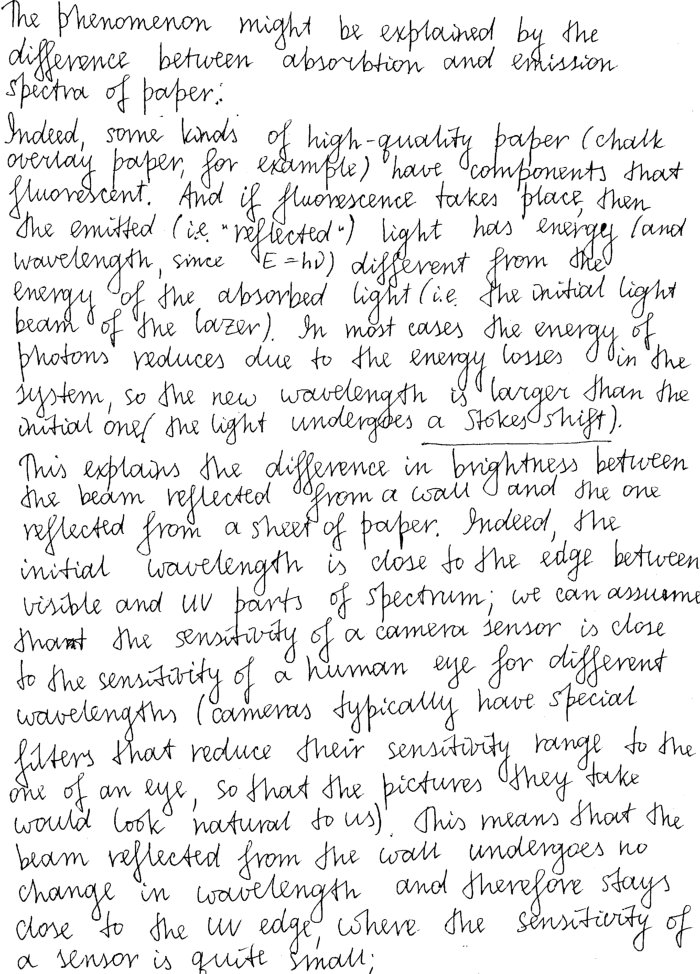

Here, a nice and detailed explanation of the fluorescence effect is provided. Overall, a solid solutions without significant omissions, submitted relatively early when the hints were not yet very detailed, which motivates receiving a quarter of the bonus.
Further, the solution of Ivan Tadeu Ferreira Antunes Filho.
Part A. Using the hint of may 14th. Divide the bright spot on the paper sheet into two halves, and correspondingly, the set of Huygens sources into two groups. When we move from a bright spot to a dark spot, this rotation angle will be of the order of  . The rotation angle will be of the order of when . The rotation angle will be of the order of when  = \lambda") as seen in the single slit diffraction. The Focal length is 300mm. The pixel length is 9.6 micrometers. The rotation angle between two neighbors pixels ( as seen in the single slit diffraction. The Focal length is 300mm. The pixel length is 9.6 micrometers. The rotation angle between two neighbors pixels ( ) is: 0,000032 rad. In the first image, the distance between a bright spot and the nearest dark ) is: 0,000032 rad. In the first image, the distance between a bright spot and the nearest dark
spots, near the center of the big bright spot is: 38±10px.  =0,6 mm")
In the second image: 40±10px  =0,6") mm. mm.
In the third image: 25±10px  =0,7") mm. mm.
In the fifth image ( wall picture) 20 ± 10px  =0,6") mm. mm.
Even that we have a really large error, about 50%, we can see that the results agree with each other. This distance was measured using a image manipulation program to raise the contrast, and measure the amount of pixels between chosen spots. I measured about 15 different distances each time, and then I found the mean distance.
Part B. Diffraction occurs only when the light has coherence. Print paper has phosphorous or another substance to make it “white”, which absorbs and re-emits the violet light. That is why the paper looks brighter than the wall, and that is why the light emitted has no coherence. The paper doesn't reflect the light, it absorbs and re-emits.
The strong points of this solution are as follows. First, the solution does not make use of the ready formula for the resolving power of a diffraction grating. This is good, because otherwise, the question about the applicability of this formula to the given case would remain open. Second, the theory is tested using all the data. All this earns him 25% of the bonus.
Next, the solution of Jakub Šafin.


This solution provides an alternative and interesting approach to the geometrical optics part. The diffraction pattern is approximated by the diffraction due to two slits; while the motivation why this can be done is not thorough, the method actually does work. Finally, this was the only solution which deducted the presence of fluorescent additives in paper from the observations (for other solutions, it was just stated that there are additives, and this explains the phenomenon). Overall – half of the bonus goes to Jakub.
The list of "best solutions" is thereby completed; however, we continue with the solution of Lars Dehlwes.
.jpg)
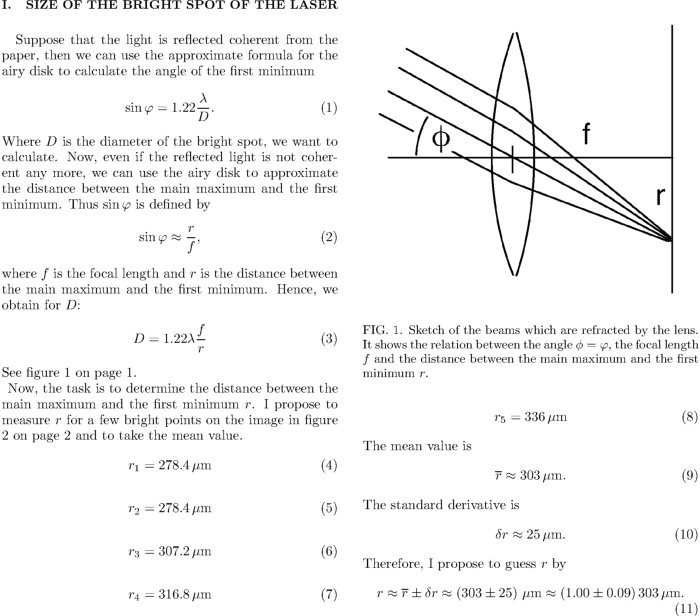
For the mentioned Fig. 3, see Wikipedia. This solution has got correct estimate, but there are several inaccuracies. First, about where should be exact equalities, and where should be approximate ones: Eq (1) should be approximate, because equality holds only for a circular piece of a flat Huygens wavefront; our Huygens wavefront is far from flat (due to the height fluctuations of the paper) and thus it serves only as an estimate for the angular distance between intensity maxima and minima. Meanwhile, Eq (2) is exact, because it relates the direction of a minimum of a parallel beam to the respective position on the sensor via geometrical optics. Also, the uncertainty of the final answer (Eq 12) is certainly underestimated (keep in mind that there is a typo, should be  mm). While the average diameter of the largest bright speckles may have been found relatively precisely, the main error comes from the approximations in theory (because of the departure of the non-flatness of the wavefront). However, the result itself is very good indeed – the actual length of the elliptical laser spot was ca 1.0mm, and the width ca 0.6mm. The main reason why Lars did not get a part of the best solution award is for not realizing that Eq (1) is an approximation. mm). While the average diameter of the largest bright speckles may have been found relatively precisely, the main error comes from the approximations in theory (because of the departure of the non-flatness of the wavefront). However, the result itself is very good indeed – the actual length of the elliptical laser spot was ca 1.0mm, and the width ca 0.6mm. The main reason why Lars did not get a part of the best solution award is for not realizing that Eq (1) is an approximation.
Next – the solution of Ng Fei Chong is written very nicely and would have been a solid candidate for a best solution, but similarly to Lars, Ng Fei assumed that  is an exact equality. is an exact equality.


Part B:

Finally, the solution of Szabó Attila.

Here, again, the same mistake is made: although we have circular bright spot, this is not equivalent to diffraction of a parallel beam from a circular opening, so the respective formula can be used only as an approximation. Otherwise it is a very nice solution; in particular, this is the only solution which explicitly states why we don't have fluorescence for green and red light.
To conclude, let us analyze the problem using vector diagrams.
.jpg)
The figure above depicts how a plane wave (the laser beam) hits the paper surface, and how the points at the paper surface work as Huygens sources and emit waves – these are the red and blue dots denoted from left to right by  til til  (different colors correspond to the different halves of the illuminated spot). Note that when we say "a point at the surface", we mean actually a surface element with a diameter much smaller than the wavelength (so that from the point of view of the emitted wave, the Huygens source is essentially a point). Let us consider the optical path difference for a given direction, and for a pair of Huygens sources, and (different colors correspond to the different halves of the illuminated spot). Note that when we say "a point at the surface", we mean actually a surface element with a diameter much smaller than the wavelength (so that from the point of view of the emitted wave, the Huygens source is essentially a point). Let us consider the optical path difference for a given direction, and for a pair of Huygens sources, and  : this can be decomposed into a random part : this can be decomposed into a random part  , and regular part , and regular part  . If we take another pair of sources, . If we take another pair of sources,  and and  , the regular part of the path difference will be the same, but the random part will take another random value (possibly correlated with the previous random value, if the index , the regular part of the path difference will be the same, but the random part will take another random value (possibly correlated with the previous random value, if the index  is small, ie. the new pair is close to the previous one). Below we have depicted, how the resulting vector amplitudes of these Huygens sources might add up (for is small, ie. the new pair is close to the previous one). Below we have depicted, how the resulting vector amplitudes of these Huygens sources might add up (for  ). ).

The left diagram corresponds to such a direction of the outgoing wave for which an intensity minimum is observed: the net amplitude is small, hence the the chain of vectors ends almost at the starting point. Meanwhile, for this same direction, the red and blue subgroups give rise typically to non-small amplitudes – these are the long vectors drawn with bold lines.
Now, let us consider a slightly different direction  of the outgoing wave. Let us require that for the light emitted by the points of the outgoing wave. Let us require that for the light emitted by the points  and and  , the regular part of the optical path difference is changed by , the regular part of the optical path difference is changed by  – half of the wavelength. The paper is relatively flat, so we can assume that – half of the wavelength. The paper is relatively flat, so we can assume that  and hence, the random part of the optical path difference remains essentially the same as it was in the case of the first direction and hence, the random part of the optical path difference remains essentially the same as it was in the case of the first direction  . Then, for the points and , the regular part of the optical path difference is changed by . Then, for the points and , the regular part of the optical path difference is changed by ") , ie. the phase change grows slowly as we move from left to right, and achieves for the middle point , ie. the phase change grows slowly as we move from left to right, and achieves for the middle point  ; this is depicted in the vector diagram in right. Note that within the blue group of vectors (as well as within the red group of vectors), the relative orientations of the vectors are changed somewhat, but not as much as between the blue group and the red group. So, as a first approximation, we can neglect the change of vectors' orientations within a group and say that (a) the vectorial sum of the red vectors almost retains its length (the same applies to the blue vectors); and (b) the bold red vector rotates with respect to the blue one by an angle, equal to the rotation angle between the vector amplitudes of the matching Huygens source pairs: ; this is depicted in the vector diagram in right. Note that within the blue group of vectors (as well as within the red group of vectors), the relative orientations of the vectors are changed somewhat, but not as much as between the blue group and the red group. So, as a first approximation, we can neglect the change of vectors' orientations within a group and say that (a) the vectorial sum of the red vectors almost retains its length (the same applies to the blue vectors); and (b) the bold red vector rotates with respect to the blue one by an angle, equal to the rotation angle between the vector amplitudes of the matching Huygens source pairs:  ; ;  , etc). Thus, for , etc). Thus, for =\lambda/2") , the bold red vector and the bold blue vector rotate with respect to each other by , and add up now in the same phase, giving rise to a maximum. In any case, we can be sure that as long as , the bold red vector and the bold blue vector rotate with respect to each other by , and add up now in the same phase, giving rise to a maximum. In any case, we can be sure that as long as \ll \lambda") , the relative orientation of the vectors remains essentially the same as depicted in the left vector diagram, hence the blue and red bold vectors have still the original length and are almost antiparallel to each other, which means that the direction of the outgoing wave corresponds still to the same intensity minimum. To conclude, a transition from an intensity minimum to an intensity maximum is achieved if , the relative orientation of the vectors remains essentially the same as depicted in the left vector diagram, hence the blue and red bold vectors have still the original length and are almost antiparallel to each other, which means that the direction of the outgoing wave corresponds still to the same intensity minimum. To conclude, a transition from an intensity minimum to an intensity maximum is achieved if =\frac d2 \cos\alpha \Delta \alpha \approx \lambda/2") . .
Now, let us discuss, what is the difference between a matte metal surface with small height variations (within few wavelengths) and a paper surface (with height variations within tens of wavelengths). For the matte surface, there are strong correlations between the random phases within red group of vectors, and within the blue group of vectors: within each group, the direction of the vectors varies only by a small amount, and hence, the resulting sums (the bold vectors) are likely to have similar lengths; if they add up in opposite phase, they almost completely cancel out each other. Meanwhile, for the paper surface, there is a lot of randomness for the orientation within the both groups. For a large number of random vectors, the length of the sum fluctuates within a wide range, and so the vectorial sums of the two groups of vectors are likely to have significant difference in length: even if they add up in opposite phase, the cancellation is relatively small. Hence, the minima are not really black: the speckle picture has smaller contrast than in the case of a matte metal surface.
|


